Debugging RealityKit apps and games on visionOS 🔬
Whether you're debugging CPU/GPU performance or asset rendering issues there are a variety of tools for troubleshooting RealityKit apps and games on visionOS.
Skip to:
- Enable visualizations
- Capture entity hierarchy
- Profile your spatial app with RealityKit Trace in Instruments
Link to this headingEnable visualizations
You can enable visualizations for your scene by clicking on the icon in the bottom drawer of Xcode while running your app.
This will help you see what's going on with your scene and entities, eg if you want to see your collision components:
Link to this headingCapture Entity Hierarchy
There's another useful debug feature that allows you to capture your entity hierarchy for debugging purposes. Click on the icon in the bottom drawer of Xcode while running your app again as shown below:
This will show you a list of all the entities and their descendants in your scene at the time of capture:
You can then use this to verify texture details, entity counts and types, number of triangles, vertices, meshes.
Or to simply figure out why a specific entity isn't rendering as expected.
Link to this headingProfile your spatial app with RealityKit Trace

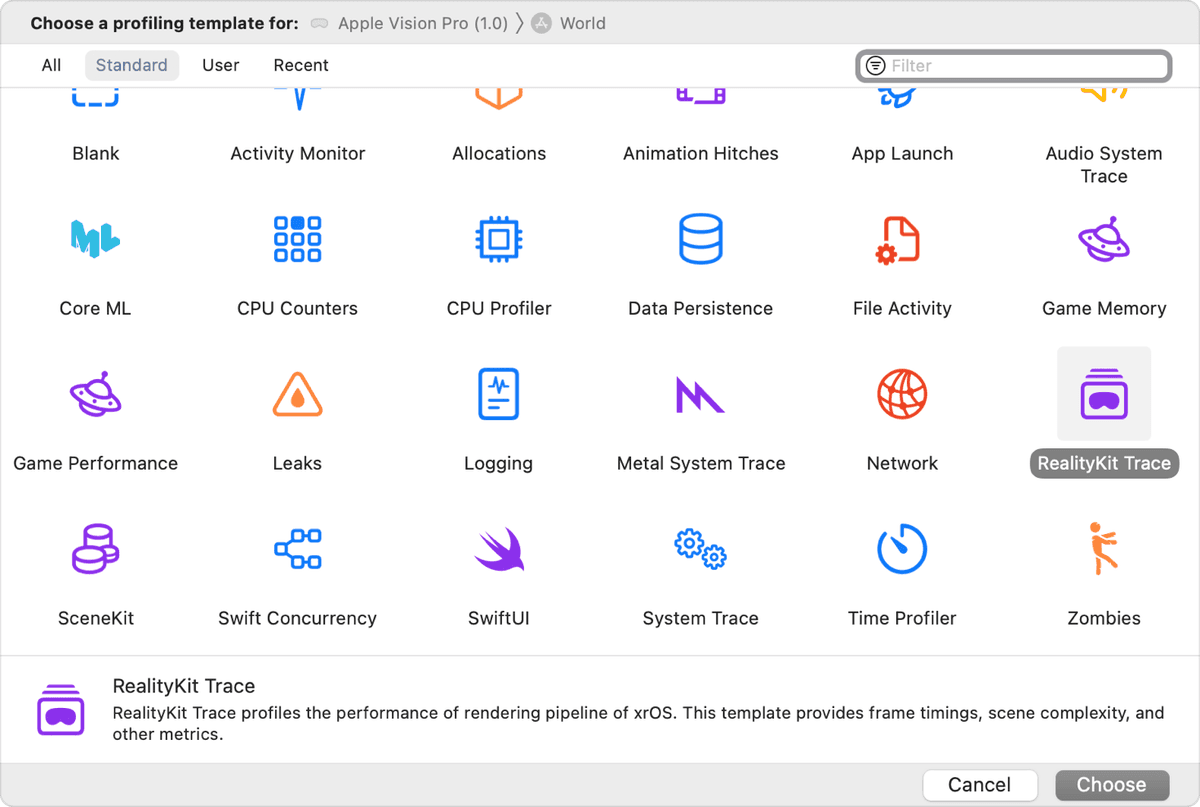
Once you've opened Instruments, select the RealityKit Trace template.
Then, in the top bar, select the simulator or your connected visionOS device (instructions/tips if your device isn't setup)

Note: You should use a real device when possible, particularly for timing/power measurements.
Then click the red record button to start and stop your trace. Switch to the simulator or your visionOS device while recording to capture the data you need.
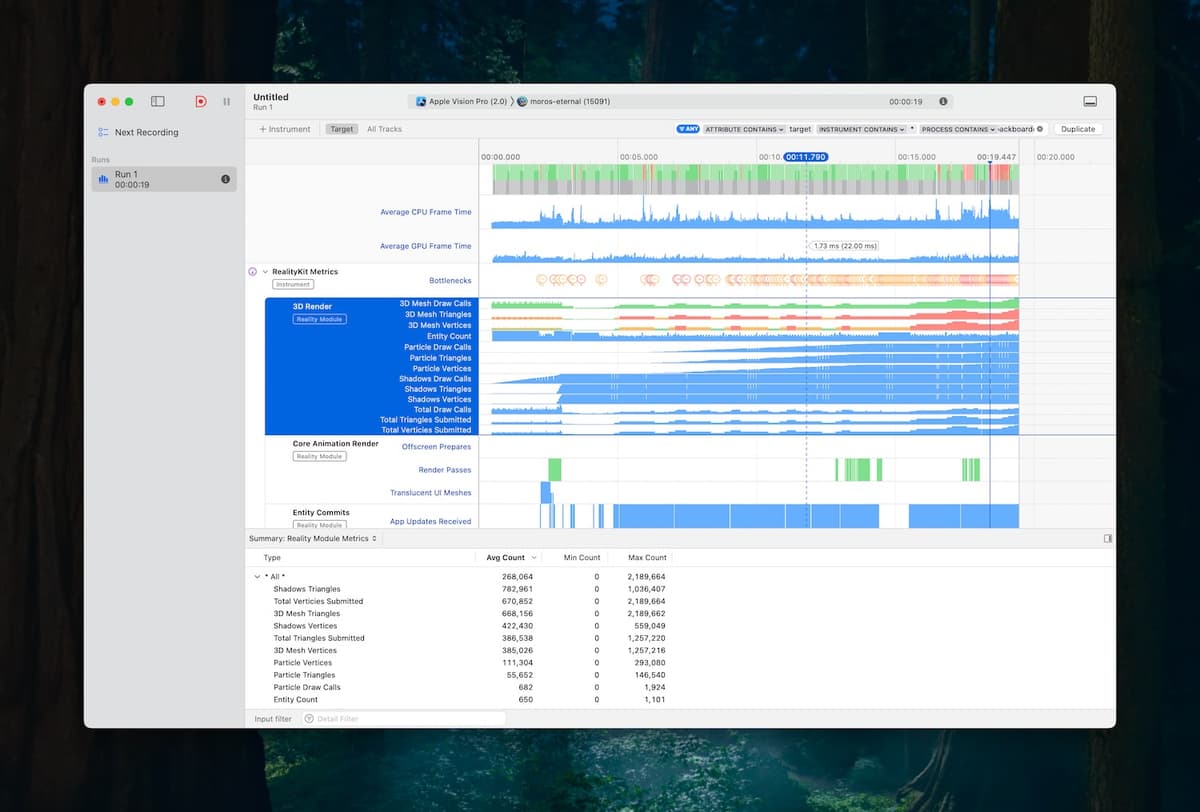
Afterwards, you'll see something like this:

There's a lot of useful information here. In RealityKit Frames, you can visualize framerate drops and frame CPU/GPU times, which will allow you to correlate them with other processes to find the source of the issue.
Let's focus on the RealityKit Metrics graph. Expand it to get information on triangles, vertices, shadows, particles and more.
Within 3D Render, you can actually see the first three rows 3D Mesh Draw Calls, 3D Mesh Triangles, and 3D Mesh Vertices. They'll be green if they're fine, red if problematic.
In my case, per the screenshot above, I had >1 million triangles on-screen, and nearly half as many vertices. So even though there weren't too many meshes (20), each mesh was contributing a lot of triangles and vertices.
I've noted some fixes in Optimizing RealityKit apps for visionOS.
Zooming back out, you can also actually get recommendations for solving your bottlenecks if you click on the Bottlenecks tab within RealityKit Metrics and look at the bottom right pane.
Finally, I recommend these two WWDC sessions for more information on navigating these tools:
And this useful doc from Apple: Analyzing the performance of your visionOS app
Link to this headingClosing
That's all for now. Check back soon, as I'll be making follow-up posts on:
- how to dig deeper into various RealityKit bottlenecks, like GPU work stalls.
- how to debug SwiftUI apps/games.
Finally, if you got something out of this and/or would like to see additional detail, I'd love to hear from you on X (formerly Twitter) or LinkedIn.